

rjsmall
-
Posts
136 -
Joined
-
Last visited
Content Type
Forums
Events
Blogs
FAQ
Tradespeople Directory
Jobs Board
Store
Posts posted by rjsmall
-
-
11 hours ago, bels123 said:
Another collision on Half Moon Lane. It’s hard to understand how this happens in a 20mph zone.
*drivers accelerate hard……we don’t have self-driving cars yet 😉
It's not hard to understand how it happens in 20mph zones - a lot of drivers ignore the speed limit knowing they are not going to get caught. There are a few static speed cameras around and that is about it - no mobile speed cameras, no average speed cameras and no police patrols enforcing the speed limit. I constantly get overtaken on the South Circular or Sydenham Hill by other drivers only to catch up with them at the next traffic light.
-
18 hours ago, Insuflo said:
What this town needs is a monorail! Yesiree!
That's more of a Shelbyville idea.
-
 1
1
-
-
My daughter has been taking the 185 from East Dulwich to St Dunstan's for the past few years and on the whole it is very reliable. There is a bus lane for parts of the journey which helps. The road works at The Grove did make the journey time a little longer but this seems to have returned to normal. It can get busy with students and sometimes she has to wait for a second bus in the afternoons.
I did check out the cycle route via Peckham Rye / Brockley Way, going over the rail bridge and via Ladywell Fields coming out at Catford Bridge but it is a bit hilly and felt a bit lonely in parts and I wouldn't feel comfortable with her cycling in the darker months of the year.
-
 1
1
-
2
-
-
The article has now been published The sex parties coming to a stately home near you
The forum even gets namechecked.
-
 3
3
-
-
Based on the videos in this story https://x.com/NFBUK/status/1787211980027101194 it does seem like a bit of an issue. Although some of the pedestrians don't do the best job of stopping and checking the crossing is clear those efforts are far better than a majority of the cyclists. I would image they are picking up a reasonable amount of speed coming downhill off the bridge and are not aware of the crossing.
-
For small businesses the merchant fees charged by the payment processing companies can eat into their margins quite significantly which is why many of them prefer cash. The strange thing is that on their webpage (https://www.ryecars.com/contact-us) it shows they accept cards - maybe it has to be over the phone or in the office with a card machine but the drivers cannot take payment.
-
The slight issue with expecting residents to clear the leaves is they need somewhere to put them - perhaps the council could provide a bin or disposal scheme for green waste such as this 😄
-
58 minutes ago, Sue said:
Does anybody have stats on the proportion of people local to this massive car park who actually use the pizza place, bowling alley and cinema?
Or the proportion of people using the pizza place, bowling alley and cinema who live, say, within a mile of it?
Thought not.
I used to live up in that direction and quite a lot of locals (families and teenagers) used the bowling alley and cinema. It was reasonably inexpensive for London and certainly cheaper than going to the West End especially for eating out. One of the nice things about Rotherhithe is (or was) the amount of green space and scarcity of tall buildings.
It is very easy to get to from here - Overground from Peckham Rye to Surrey Quays or P12 bus.
-
Loads up okay for me:

-
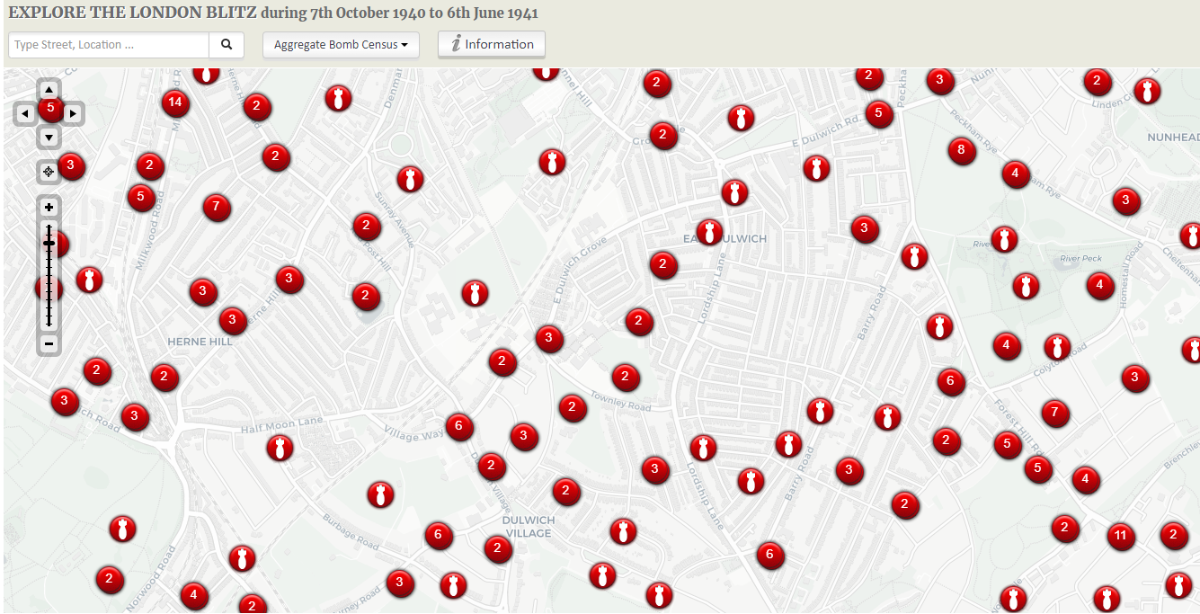
There is also this site http://bombsight.org which gives details on the bomb that struck during the Blitz
-
From what I have seen in the past the person locking up drives around and locks each gate as they go. I am surprised there isn't a one way turnstile gate somewhere as I have been locked in (managed to climb over a gate) and know several others that have been locked in.
-
2
-
 1
1
-
-
I think you are correct - there is a sign on Lordship Lane just near the BT phone exchange which appears to indicate that you cannot turn on to Court Lane but I think it is misleading and is referring to turn at the end on to Carlton Avenue. I am not sure why the sign is positioned there and not before the intersection with Eynella Road where it would be more accurate.
-
I'd recommend Isabelle Capitain on Upland Road (Isabelle Capitain – Handmade Jewellery – Jewellery Handmade In London (isabelle-capitain.co.uk)
She does her work onsite (you can often see her working throughout the day) and has done numerous repairs for my family.
-
2
-
-
Unfortunately it replies upon residents having a place put the leaves. Seems a bit slack of the council to not clear the leaves from the tress and rely upon residents to put them in a brown bin which they also have to pay the council to have.
-
49 minutes ago, Jenijenjen said:
There are very many council tax payers in Southwark who do not have the luxury of a garden, even in East Dulwich, and it would be unreasonable to expect them to subsidise the lucky ones who do.
That could be applied to many items of council spending though (eg. should residents without children subsidise playgrounds in parks) This time of the year a lot of the leaves that go in my brown bin are from the councils trees on the pavement and road that they don't bother to clear.
-
1
-
-
Are the surrounding wards getting CPZs? If so then it may just move parking pressure to Dulwich Hill leading to residents requesting a CPZ down the line.
-
Hi mcbilkur,
my daughter uses the 185 to get to and from school and the timetable can always be a bit erratic I think mainly due to traffic on the route. She uses the TfL Go app to check when the buses are due as this uses the same source as the Countdown timers and that seems to be the most reliable way. I think like a lot of bus routes the timetable is a nice idea but isn't accurate due to traffic / roadworks / driver changes etc.
-
1
-
-
19 hours ago, Earl Aelfheah said:
What I have yet to hear, is why people think that everyone else should subsidise free on street car storage, on top of all the other externalised costs of motoring visited upon others.
You could apply that argument to any form of taxation - should people who don't have children have to contribute to schools, should people who don't use libraries have to contribute to those, should people who don't ride a bike contribute to the building of cycle lanes etc etc.
-
I'm not sure how mixing a school street with buses is going to work. Whereas other school streets are completely closed to motorised traffic this seems like the potential for confusion is high. The junction of Friern Road and Etherow Street is already pretty bad for parking violations at school pick up and drop off. I can't see this improving that.
-
Hmm this is slightly awkward https://www.telegraph.co.uk/news/2023/07/01/low-traffic-neighbourhoods-anna-goodman-removes-poster-cctv/
-
10 minutes ago, exdulwicher said:
Process of validation, time, resources, the fact that most people don't understand data anyway and it needs to be worked up into a presentable format showing clear information about pollution/traffic trends... Quarterly updates are about as precise as you need to be and to factor in seasonal variations, school holiday periods etc but annual works just as well for that. Air pollution in particular is not easy to monitor or model because it's so weather dependent (although as a general rule the fewer emissions going into the air from whatever source - transport, heating etc, the better...)
I agree with that approach as long as the council made the raw traffic count and pollution data available to the public (who are paying for it to be collected after all) - not sure if it would be covered under the Freedom of Information Act.
I think doing that would allow independent analysis of the data and would show that the council is not manipulating, skewing or cherry picking data.
-
The terrapins have been there for many years. I remember looking at them sunning themselves on the rocks when my daughter was small enough to go to the infants playground and that is at least seven years ago.
-
1
-
-
There is also Supa Ya Ramen on Rye Lane https://goo.gl/maps/iv7cxrGWCtXF4TQS9
-
What flawed statistics? You mean specific local vehicle counts, or the body of academic research on LTNs in general (all of which points to reductions in traffic and pollution where LTNs have been introduced...for example: https://www.sciencedirect.com/science/article/pii/S1361920922003625)
I don't see the problem with flawed statistics with that paper as they will just analyse the data provided to them. The issue is more likely to be with "traffic volume data provided by the local authority" If Islington have done similar to Southwark where traffic counters are placed in locations where traffic is too slowly moving to record accurate counts then it is worthless. The "garbage in - garbage out" principle applies.
Dangers of current levels of air pollution in the UK
in Roads & Transport
Posted
Seems to be a very divisive article title with the area cherrypicked to to provide the class warfare angle.
I'm pretty sure if similar pollution measurements were taken at the Friern Road / Etherow Street junction (near St Anthony's) or Whatley Road / Landcroft Road junction (near Harris East Dulwich) the results would be about the same.